Charts provide a quick way to understand a security's historical price performance. StreetSmart.com® charts provide vast amounts of data in an efficient, user-friendly, customizable format, making it easy to analyze price and volume movements amid constantly changing market conditions.
You have 4 charts available for quick viewing under the Charts tab, and you can save additional charts for later viewing. Click on the links below for information about using the Charts tab:
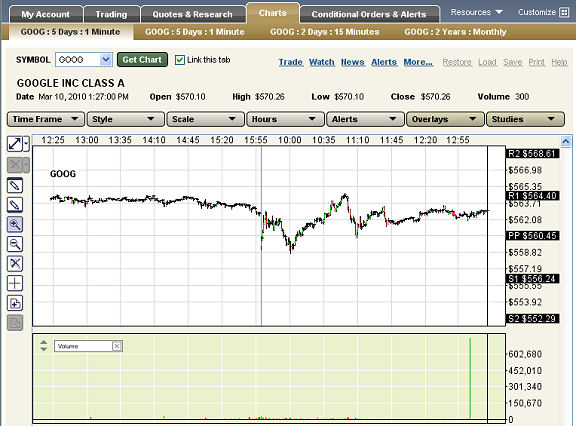
Stock and/or option symbols and price and volume data shown here are for illustrative purposes only. Charles Schwab & Co., its parent or affiliates, and/or its employees and/or directors may have positions in securities referenced herein, and may, as principal or agent, buy from or sell to clients.
![]() Get a quick overview
of all the Chart Tab features in this self-paced Charts
training course.
Get a quick overview
of all the Chart Tab features in this self-paced Charts
training course.
Copyright ©Charles Schwab & Co., Inc. 2011. All rights reserved. Member SIPC. (0111-0422)