Chart Overlays
Chart
overlays allow you to superimpose on your chart certain technical studies
or an additional security or index chart. This allows you to see how movements
in the overlay correlate to movements in the security price. Study Overlays: Some
traders find that the relationship between a study's lines and the price
chart may be an early indicator of shifting price trends. They may use
this information as part of the decision to enter a position if the trend
seems positive, or exit or short if it suggests a downward trend. Index and Security Overlays: Comparing
an index or other security can help demonstrate how the stock is performing
in relationship to the market. Setup Chart Overlays by clicking Overlays
button above the chart. You may have up to 10 overlays per chart. |
NOTE: Interpreting studies is
a complex subject, so it is recommended that you learn as much as possible
about Bollinger Bands and Moving Averages before incorporating these Chart
Overlays into your trading strategy. Many books, web sites,
and third party educators are available to further your understanding
of Technical Analysis.
 Get a quick overview
of all the Chart Tab features in this self-paced Charts
training course.
Get a quick overview
of all the Chart Tab features in this self-paced Charts
training course.
Overlays can display another symbol, index chart, Bollinger Bands, SMA,
EMA, or MA Envelope on top of your current chart.
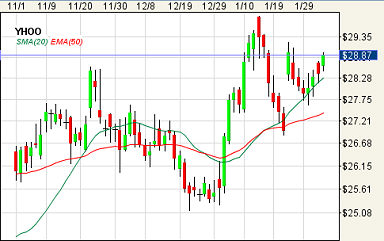
Stock and/or option symbols and price and
volume data shown here are for illustrative purposes only. Charles Schwab
& Co., its parent or affiliates, and/or its employees and/or directors
may have positions in securities referenced herein, and may, as principal
or agent, buy from or sell to clients.
A variety of pre-set overlays are available, any of which you can enable
or disable for a chart by clicking the box next to the item.
- Bollinger
Bands - The top and bottom lines are placed n-standard deviations
above and below the calculated simple moving average. Since standard deviations
are a measure of volatility, the bands widen during volatile price action
and contract when the trading range tightens. You can change the variables
used in the calculation from the defaults of 20 periods (based on Frequency)
and n=2 standard deviations above and below.
- Moving Average
Envelope (MAE)- Employing
an Envelope is similar to Bollinger Bands, except equidistant from the
center average, in that the Envelope helps define the upper and lower
boundaries of a security's normal trading range. When the security reaches
the upper band, this may indicate a sell opportunity, whereas the security
reaching the lower band may indicate a buy opportunity. Default of 21
periods with Upper and Lower % default of 3 can be changed.
- SAR (Parabolic
Stop & Reverse) - Typically used
in a trending market, the Parabolic SAR study uses parabolic curves
based on a security's price movement to indicate potential exit points.
Default acceleration factor is 0.02 with a max acceleration limit of 0.20.
In a trending market when the SAR falls below the price, this is typically
viewed as bullish or short position exit point indicator. When the SAR
rises above the price, this is typically viewed as bearish or a long position
exit point indication. - Pivot Points - Uses the previous day high, low, and close price to generate a pivot line, two support levels (S1 & S2), and two resistance levels (R1 & R2). This study is only displayed on Intraday charts. Check the lines you wish to view: R2, R1, Pivot, S1, S2
NOTE: Pivot Point lines may not be visible depending on the price scale you have set, and the price discrepancy between the previous and the current trading day.
Pivot Points are calculated:
Pivot = ( YesterdaysHigh + YesterdaysLow + YesterdaysClose ) / 3.0;
S1 = 2.0 * Pivot - YesterdaysHigh;
R1 = 2.0 * Pivot - YesterdaysLow;
S2 = Pivot - ( R1 - S1 );
R2 = Pivot + ( R1 - S1 ); - Moving
Averages - Choose up to four Simple or Exponential Moving Averages
with customizable periods.
- Simple
Moving Average (SMA)- The average of the last n-periods close values
including current day. If current trading session hasn't closed yet, the
last sale price is used. The default of 20 or 50 periods can be changed.
- Exponential
Moving Average (EMA)- While similar to the SMA, the exponential
moving average uses a "smoothing factor" to give more weight
to recent prices, while allowing all prices in the window to influence
the average. The default of 20 or 50 periods can be changed.
- Symbols - Choose from the DJI (Dow Jones Index),
NYSE, S&P 500, S&P 100, Nasdaq Composite, AMEX Composite, Russell 200, and/or CBOE 30-year,
or check the Symbol box and type the symbol you wish to overlay on the
chart.
- Check
Compare by Price to show both symbols with two separate price
scales, the main price scale on the right and the overlay price scale
on the left, as shown below.
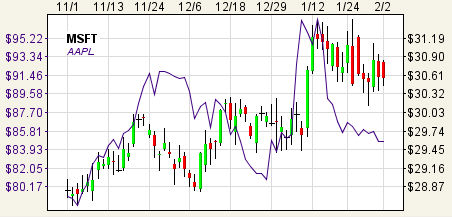
Stock and/or option symbols and price and volume data shown here are
for illustrative purposes only. Charles Schwab & Co., its parent or
affiliates, and/or its employees and/or directors may have positions in
securities referenced herein, and may, as principal or agent, buy from
or sell to clients.
Copyright ©Charles Schwab & Co., Inc.
2011. All rights reserved. Member SIPC.
(0711-4448)