Use the Charting Toolbar, on the left side of the chart, to:
|
NOTE: Interpreting trend, support, and resistance lines is a complex subject, so it is recommended that you learn as much as possible about them before incorporating them into your trading strategy. Many books, web sites, and third party educators are available to further your understanding of Technical Analysis.
![]() Get a quick overview
of all the Chart Tab features in this self-paced Charts
training course.
Get a quick overview
of all the Chart Tab features in this self-paced Charts
training course.
 | Trend lines | Choose to draw one of the following types of trend lines. For each, click the starting point and then click again where you want to set the end point.
Add a Label: You may add a label for each line you draw in the Label field. Doing so will help you identify lines when you need to remove them. To add a trend line, click at the start point of your trend line and then move your mouse to the end point of your trend line and click again. You may draw up to 10 lines per chart. To move a trend line, click the trend lines icon again (so that it is no longer highlighted). This will stop drawing new trend lines. Then place your mouse over the start or end point of the line you want to move. When the larger square appears around the start or end point square, click and drag the point to a different spot on the chart and the line will move. |
 | Remove Trend Line(s) | Click the icon to remove ALL trend lines, or click the arrow to choose an individual trend line to remove. |
| Resistance Line | Click to display a resistance line on the chart. Move the line to the price resistance level you identify, and then click again to set the line. To remove, click the Resistance Line button again. |
| Support Line | Click to display a support line on the chart. Move the line to the price support level you identify, and then click again to set the line. To remove, click the Resistance Line button again. |
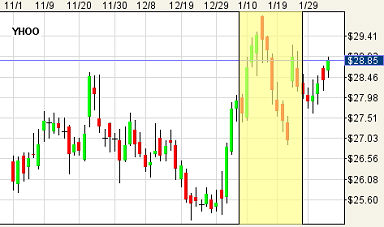
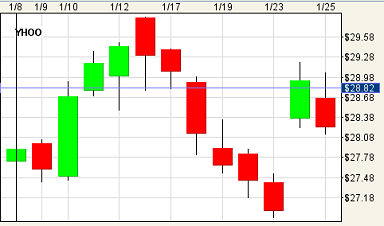
| Zoom in/Zoom Out/Restore | The zoom button is to the left of the chart
in your chart tab. Click the Example: The yellow selected area in picture A zooms to the image in picture B. A B Stock and/or option symbols and price and volume data shown here are for illustrative purposes only. Charles Schwab & Co., its parent or affiliates, and/or its employees and/or directors may have positions in securities referenced herein, and may, as principal or agent, buy from or sell to clients |
| Crosshairs | Click to change the cursor to a crosshair
Stock and/or option symbols and price and volume data shown here are for illustrative purposes only. Charles Schwab & Co., its parent or affiliates, and/or its employees and/or directors may have positions in securities referenced herein, and may, as principal or agent, buy from or sell to clients |
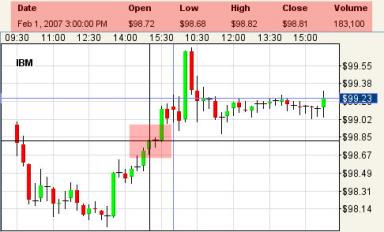
| Add Note | Chart Notes are memos that you can place at specific points on a chart. You may "pin" notes to your charts to keep track of positions, stop loss values, or anything else. Notes are saved from session to session and will always display in the same date/price location on the chart. Add up to 5 notes per symbol. Below, we have added a note and by hovering the mouse over it, we see it is regarding a short position we opened on 4/14 at 28.80.
Stock and/or option symbols and price and volume data shown here are for illustrative purposes only. Charles Schwab & Co., its parent or affiliates, and/or its employees and/or directors may have positions in securities referenced herein, and may, as principal or agent, buy from or sell to clients To add a note:
|
| Find Note | The Find Note tool
|
Copyright ©Charles Schwab & Co., Inc. 2005- 2017. All rights reserved. Member SIPC. (0817-7JNG)