Chart Studies
Chart
Studies use a stock's price movements, volume, and other historical information
to attempt to find patterns that may indicate shifting price trends. By learning what a particular study may
be indicating and then applying that study to your charts, you may be
able to identify trading opportunities, points of support or resistance
at certain price thresholds, price trends, and more. Setup Chart Studies by clicking the Studies drop-down above the chart. |
NOTE: Interpreting studies is
a complex subject, so it is recommended that you learn as much as possible
about each study before incorporating its feedback into your trading strategy.
Many books, web sites, and third party educators
are available to further your understanding of Technical Analysis.
 Get a quick overview
of all the Chart Tab features in this self-paced Charts
training course.
Get a quick overview
of all the Chart Tab features in this self-paced Charts
training course.
You may position up to 4 technical analysis studies, including volume,
in each chart.
Studies may be positioned above or below the chart using the up/down
arrows in the upper left corner of each study. You can also remove a study
from the display by clicking the X
button next to the name of the study.
Available Studies:
- Average True Range - Measures a security's volatility by averaging the True Range over a
period of time you specify when setting up the study. Default of 14 periods can be changed. True Range is the
greatest of the following:
- The
current high minus the current low.
- The
absolute value of the current high less the previous close.
- The
absolute value of the current low less the previous close.
- CCI
(Commodity Channel Index) - Measures the variation of a security's
price from its statistical mean. High values show that prices are unusually
high compared to average prices whereas low values indicate that prices
are unusually low. Default
of 20 periods (minutes, hours, days, etc.)
- Fibonacci
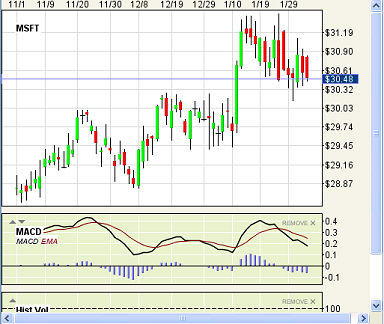
- MACD
(Moving Average Convergence Divergence) - A trend-following momentum
indicator using 3 exponential moving averages: a short or fast average,
a long or slow average, and an exponential average of their difference
(the last used as a signal or trigger line). The periods defaults for
the calculation are 12, 26 and 9.
- Momentum
- Measures the amount that a security’s price has changed over the last
14 days. If today has not closed yet, it uses the current price for today’s
close. Default
of 14 periods (minutes, hours, days, etc.)
- OBV - On
Balance Volume - Relates volume to
price changes by adding volume to a running total when the price closes
up for a period, then subtracts the volume if the stock closes down for
a period.
- Put/Call
Ratio - Shows the number of puts divided
by the number of calls based on open interest for individual stocks or
indices. The ratio is often used as a contrary market indicator, which
means that a high ratio may be a bullish indicator and a low ratio is
often interpreted as a bearish indicator. This study may be expressed
in actual or simple moving average (SMA) format. Available
for daily, weekly and monthly charts for optionable securities.
- ROC - Rate
of Change - Change in price between
the current price and the close 20 days ago, divided by the price 20 days
ago. Default
of 20 periods (minutes, hours, days, etc.) Technical
study parameters will be configurable.
- RSI
- Relative Strength Index - Indicates the degree of positive and
negative movement by the security on a scale of 0 (weakest) to 100 (strongest).
Determined by figuring the ratio of the average up closes for the last
13 days (using today's Current Price for the 14th day) divided by the
sum of the average up closes and the average down closes for the same
period. This ratio is multiplied by 100. The
initial value of an n-period RSI is based on the price action for the
first n periods. Subsequent values are determined using an inductive formula.
Default
of 14 periods (minutes, hours, days, etc.)
- RSI
(Adaptive) - Adapts the standard RSI to a smoothing constant. Default
of 14 periods (minutes, hours, days, etc.)
- Stochastic
(Fast) - The Fast Stochastic is the average of the last three %K
and a Slow Stochastic is a three day average of the Fast Stochastic. Use
as a buy/sell signal generator, buying when fast moves above slow and
selling when fast moves below slow. The
default for the calculation should be %K-14 periods, %D-3 periods, and
3 periods.
- Stochastic
(Slow) - Similar in principle to %D, %D Slow represents a slower,
less volatile indicator that simply adds an additional degree of smoothing,
or moving average period, to the original %D. The default for the calculation
is %K-14 periods, %D-3 periods, and 3 periods.
- Williams
%R - A momentum indicator that measures
overbought and oversold levels. The interpretation of Williams %R is very
similar to that of the %K stochastic indicator. The oversold indications
are in the range of -80 to -100, while the overbought indications are
in the range of -20 to 0. The
default for the calculation is a period of 14.
- Volatility
- Measurement of change in price over
a given period. It is usually expressed as a percentage and computed as
the annualized standard deviation of the percentage change in daily price.
- Historical Volatility - Reflects how
far an equity’s price has deviated from its average price over the number
of periods you specify. This study only applies to Daily, Weekly, and
Monthly charts. Default of 20 periods.
- Implied Volatility - A
theoretical value (in %) designed to represent the forecasted volatility
of the security or index as determined by the prices of multiple call
and put options using the Black-Scholes pricing model.
Choose to view the Average of Puts & Calls (Avg),
Average of Puts (Puts),
or Average of Calls (Calls).
Also, choose whether to view actual implied volatility (IV
Actual) or a simple moving average of implied volatility (IV SMA). Default
period for the IV SMA is 20.
*Implied Volatility studies are only available on daily, weekly,
and monthly charts for optionable securities. Implied Volatility values
are computed using the Black-Scholes model and may not be available on
all underlying securities. The Schwab Avg – Implied Volatility, Call -
Implied Volatility, and Put - Implied Volatility, while based on the Robert
E. Whaley calculation, are derived using methods that may differ from
those used by other data providers.
-AVG: The formula used in calculating this value is:
2 in-the-money calls (nearest to the current underlying price)
+
2 in-the-money puts (nearest to the current underlying price) for
the two nearest expirations +
2 out-of-the-money calls (nearest to the current underlying price)
+
2 out-of-the-money puts (nearest to the current underlying price)
for the 2 nearest expirations /16
-Calls or Puts:
The formula used in calculating this value is:
2 in-the-money calls/puts (nearest to the current underlying price)
for the two nearest expirations +
2 out of the money calls/puts (nearest to the current underlying
price) for the two nearest expirations /8
- Volume
- Simply the number of shares (or contracts) traded during a specified
time frame (e.g., hour, day, week, month, etc).
Copyright ©Charles Schwab & Co., Inc. 2005-
2017. All rights reserved. Member SIPC.
(0817-7JNG)