Chart Studies use a stock's price movements, volume, and other historical information to attempt to find patterns that may indicate shifting price trends.
By learning what a particular study may be indicating and then applying that study to your charts, you may be able to identify trading opportunities, points of support or resistance at certain price thresholds, price trends, and more.
Stock symbols and price and volume data shown here and in the software are for illustrative purposes only. Charles Schwab & Co., Inc., its parent or affiliates, and/or its employees and/or directors may have positions in securities referenced herein, and may, as principal or agent, buy from or sell to clients.
 Add studies to a chart from the Chart Settings panel on the right side of the Chart tool. You can also right-click in the chart and select Add Study. Or for more on using studies in charts, see Chart Settings:Studies.
 Get a demonstration and more information on Chart Studies.
| Study Name | Description |
| Intraday | |
| Last Close |
When selected with an intraday chart, a line will display indicating the prior day's close price. |
| Pivot Point |
Uses the previous day high, low, and close price to generate a pivot line, two support levels (S1 & S2), and two resistance levels (R1 & R2). This study is only displayed on Intraday charts. In the studies settings (right-click on the study and select Edit), you may check the lines you wish to view: R2, R1, Pivot, S1, S2
|
| Market Strength | |
| Adaptive RSI (Relative Strength Index) |
Adapts the standard RSI to a smoothing constant. Customizable default of 14 periods. For calculation purposes, Adaptive RSI is somewhat similar to an exponential moving average, but instead of averaging prior values using a fixed percentage, it uses a variable percentage based on the RSI. |
| Money Flow |
Money Flow keeps a running total of the money flowing into and out of a security. The direction of the Money Flow line is the important component to watch, not the actual dollar amount. This indicator can be used to confirm underlying strength or weakness of a price trend. |
| Money Flow Percent |
Money Flow Percent normalizes the Money Flow calculation above by dividing by the cumulative volume for the period. You can change the periods used in the calculation from the default of 14. |
| Put/Call Ratio - Open Interest |
Shows the number of puts divided by the number of calls based on open interest for individual stocks or indices. The ratio is often used as a contrary market indicator, which means that a high ratio may be a bullish indicator while a low ratio is often interpreted as a bearish indicator. The put/call ratio study can display the P/C Actual value, where each individual data point represents the raw put/call data, or the P/C SMA (simple moving average – the average of the raw data over the selected time period) of the study. Available for daily, weekly and monthly charts for optionable securities. |
| Relative Strength Index |
Indicates the degree of positive and negative movement by the stock on a scale of 0 (weakest) to 100 (strongest). Determined by figuring the ratio of the average up closes for the last 14 days (using today's current price for the 15th day) divided by the sum of the average up closes and the average down closes for the same period. This ratio is multiplied by 100. You can change the number of periods used in the calculation from the default of 14, and you can chose which Average price to base the study on (Close, Open, etc.) from the study settings. The initial value of an n-period RSI is based on the price action for the first n periods. Subsequent values are determined using an inductive formula, analogous to the EMA formula described earlier. |
| Stochastic RSI |
Plots the Stochastic %D line of the RSI (Relative Strength Index) to represent the level of the RSI indicator relative to its range over the number of periods you specify. Default of 14 Stochastic and RSI periods, as well as the default Slowing Factor of 1 can be changed. You can also check the Ten Grid Lines box to display lines from 0.1 to 0.9 instead of two lines at .25 and .75. |
| Momentum | |
| CCI |
The Commodity Channel Index (CCI) measures the variation of a security's price from its statistical mean. High values show that prices are unusually high compared to average prices whereas low values indicate that prices are unusually low. Contrary to its name, the CCI can be used effectively on any type of security, not just commodities.
|
| Momentum |
Measures the amount the price of a security has changed over the last 14 days. If the current trading session today hasn't closed yet, it uses the last sale price. You can change the periods used in the calculation from the default of 14. |
| Rate of Change |
Change in price between the current price and the close 12 periods ago, divided by the price 12 periods ago. You can change the number of periods used in the calculation. |
| Stochastic Oscillator |
Stochastic - %K: Part of the stochastic indicator along with %D. Shows the price level of a stock in relation to its price range over a given period. You can change the period used in the calculation from the default of 14 periods. Stochastic - %D: Part of the stochastic indicator along with %K. Shows the degree of smoothing, or moving average period, of %K. You can change the periods used in the calculation from the default of 14 periods and 3 periods. For calculation purposes, %D is an SMA of %K below. Stochastic - %D Slow: Similar in principle to %D, %D Slow represents a slower, less volatile indicator that simply adds an additional degree of smoothing, or moving average period, to the original %D. You can change the period used in the calculation from the default of 14 periods, 3 periods, and 3 periods. For calculation purposes, %D Slow is an SMA of %D above. |
| Williams % R |
A momentum indicator that measures overbought and oversold levels. The oversold indications are in the range of -80 to -100, while the overbought indications are in the range of -20 to 0. You can change the periods used in the calculation from the default of 14. For calculation purposes, %R is simply %K - 100. |
| Trend | |
| Directional Mov Index |
The Directional Movement study indicates the strength of a trend, independent of whether that trend is up or down. The study combines several components: +DI measures upward moves, -DI measures downward moves, DX combines +DI and -DI, and ADX is a smoothed version of DX. In the Study settings (right-click on the study and choose Edit), you can remove or add any of the four lines that make up the DMI: |
| Exponential Moving Average (EMA) |
While similar to the SMA (simple moving average), the exponential moving average uses a "smoothing factor" to give more weight to recent prices, while allowing all prices in the window to influence the average. Customizable default of 20 periods. Default study shift is 0. |
| Geometric Moving Average (GMA) |
A moving average weighted on the price movement relative to the stock price, so that a $1 increase in a $5 stock is represented on the chart as a much greater move than a $1 increase in a $75 stock. |
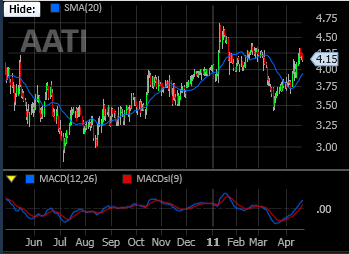
| Moving Average Conv/Divergence (MACD) |
A trend-following momentum indicator using 3 exponential moving averages: a short or fast average, a long or slow average, and an exponential average of their difference (the last used as a signal or trigger line). You can change the periods used in the calculation from the defaults of 12 and 26. The default signal line has 9 periods. You can also change the average price on which the study is based. |
| MACD Histogram |
A variation of the MACD that plots the difference between the Signal Line and MACD. Changes in the spread between these two lines may be spotted faster, potentially leading to earlier trading signals. You can change the periods used in the calculation from the defaults of 12, 26, and 9. |
| Parabolic SAR |
The Parabolic SAR (stop and reverse) is a trend-following indicator that may help establish stop loss parameters, as well as signaling opportune times to buy or sell a stock. Because it's a trend-following indicator, it tends to be less useful in a sideways market and more useful in a strongly trending market. A line above the price may indicate a bearish trend, and a line below the price may point to a bullish stock. |
| Price Lines | View one or all of the Open, High, Low, and/or Close for the symbol as individual price lines. |
| Price Relative | Compare the performance of one security to another with a ratio chart. This makes it possible to determine if a stock is leading or lagging its peers. Enter the symbol in the Compare To: field when setting up the study. |
| Simple Moving Average (SMA) |
The average of the last 20 periods' closing values including current day. If current trading session hasn't closed yet, the last sale price is used. The default of 20 periods can be changed. |
| Smoothed Moving Average (OMA) |
An exponential moving average with a longer period used to determine the average, as older prices are never removed from the calculation but are given less weight. Best used in trending markets. The initial value of an n-day OMA is the same as the initial value of an n-period SMA indicator. Subsequent values are determined using an inductive formula, in the manner of the EMA described above. |
| Volatility | |
| Average True Range |
Measures a security's volatility by averaging the True Range over a period of time you specify when setting up the study. True Range is the greatest of the following:
Customizable default of 14 periods. |
| Bollinger Bands |
The Upper and Lower lines are placed n-standard deviations above and below the Mid line (simple moving average). Since standard deviations are a measure of volatility, the bands widen during volatile price action and contract when volatility drops. You can change the variables used in the calculation from the defaults of period=20 and n=2 standard deviations above and below. Rather than two bands that are always an equal percentage away from the central average, Bollinger Bands expand and contract based on the standard deviation of the historical volatility of the price action. |
| Envelope |
Employing an Envelope is similar to Bollinger Bands, except equidistant from the center average, in that the Envelope helps define the upper and lower boundaries of a security's normal trading range. When the security reaches the upper band, this may indicate a sell opportunity, whereas the security reaching the lower band may indicate a buy opportunity. Customizable default of 21 periods with Upper and Lower % default of 2.5. |
| Historical Volatility |
Reflects how far an equity's price has deviated from its average price over the number of periods you specify. This study only applies to Daily, Weekly, and Monthly charts. Customizable default of 20 periods, and you can choose the Average price the study is based on (Close, Open, etc.) from the study settings. |
| Implied Volatility Avg/Calls/Puts |
The theoretical value (in %) designed to represent the forecasted volatility of the security or index as determined by the prices of multiple call and put options using the Black-Scholes pricing model. Choose to view the Average of Puts & Calls (Avg), Average of Puts (Puts), or Average of Calls (Calls). Also, choose whether to view actual implied volatility (IV Actual) or a simple moving average of implied volatility (IV SMA). Customizable default period for the IV SMA is 20. Implied Volatility studies are only available on daily, weekly, and monthly charts for optionable securities. Implied Volatility values are computed using the Black-Scholes model and may not be available on all underlying securities. The Schwab Avg – Implied Volatility, Call - Implied Volatility, and Put - Implied Volatility, while based on the Robert E. Whaley calculation, are derived using methods that may differ from those used by other data providers. |
| Keltner Channels |
Keltner Channels consist of two bands that are not equidistant from the EMA. Rather than two bands that are always an equal percentage away from the EMA, Keltner Channels expand and contract based on a moving average of the True Range (TR). Customizable default of 20 periods, 10 ATR (Average True Range) Periods, and an ATR factor of 2. Use SSPro4 calculation: StreetSmart Edge uses the modern calculation for Keltner Channels, which uses EMA rather than SMA as the signal line. However, if you want Keltner Channels to continue using SMA as the signal line, check this box. |
| True Range |
True Range is the greatest of the following:
|
| Volume | |
| On Balance Volume (OBV) |
This indicator relates volume to price changes by adding volume to a running total when the price closes up for a period, then subtracts the volume if the stock closes down for a period. You can overlay the study on or underneath the price chart. |
| Volume |
Simply the number of shares (or contracts) traded during a specified time frame (e.g., hour, day, week, month, etc). |
 Pivot Point lines may not be visible depending on the price scale you have set in the chart settings and the price discrepancy between the previous and the current trading day.
  Formula
 for t < n
 for t >= n
 and n is the RSI period (i.e. an n-period RSI).
 for all
 for all
 if
if  >0 and 0 otherwise,
 if
if  <0, 0 otherwise

 )
)


 if the denominator > 0; 0 otherwise
 and
and 
 ,
,


 is
is  if > 0; 0 otherwise.
  is
is  if > 0; 0 otherwise.
  .
. where Price is set to the Average price variable you select when you set up the study. F (Factor) can theoretically be any value between 0 and 1 but is generally related to an n-period SMA by the formula
 where Price is set to the Average price variable you select when you set up the study.
 is
is
 ,
,
 if
if 
 if
if