Stock symbols and price and volume data shown here and in the software are for illustrative purposes only. Charles Schwab & Co., Inc., its parent or affiliates, and/or its employees and/or directors may have positions in securities referenced herein, and may, as principal or agent, buy from or sell to clients.
|
A |
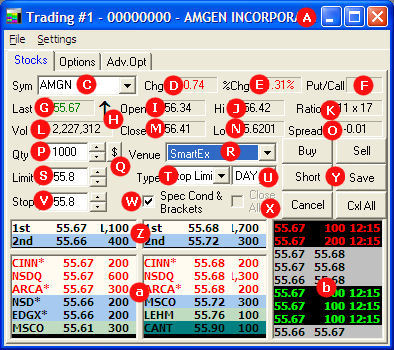
Company Name/ Market |
Shows the company name and the market on which the stock trades. A letter after the security name is the Financial Status Indicator (FSI). TIP: To view the current quote for an index, Level 1 needs to be enabled. Enable Level 1 in the Trading Window menu by clicking Settings > General > L2 Data tab and then checking Level 1. |
| Level I Data | ||
|
C |
Symbol |
To enter a new symbol, click in the field, type the new symbol, and press Enter on your keyboard. Click on the down arrow to show recently loaded symbols. Select a symbol from this list for rapid reloading. |
|
D |
Change ($)
|
Shows the change in price from close. This can be changed to reflect the change from the opening price by checking Calculate Change from Open in the Settings > General menu of the Trading window. |
|
E |
Change (%) |
Shows the percent change from close. This can be changed to reflect the change from the opening price by checking Calculate Change from Open in the Settings > General menu of the Trading window. |
|
F |
Put/Call |
Shows the Put/Call ratio for Open Interest in the stock or index. You may choose to show the Volume Put/Call ratio instead by going to Settings > General > L1 Data. Put/Call Ratio shows the number of puts divided by the number of calls based on open interest or daily trading volume for individual stocks or indices. The ratio is often used as a contrary market indicator, which means that a high ratio may be a bullish indicator and a low ratio is often interpreted as a bearish indicator. Open Interest updates once a day early in the morning, where as Volume updates every 15 seconds during market hours only. For both Open Interest and Volume, Schwab calculates the values using all option contracts currently trading for the underlying security/index/ETF. |
|
G |
Last |
Shows the last price at which the stock traded. Red indicates the price was down from the previous sale, and green means the price was up from the previous sale. |
|
H |
Tick Direction |
Shows whether the stock is on a downtick or uptick. |
|
I |
Open |
Shows the price at which the stock opened today. |
|
J |
Hi |
Shows the highest price the stock has reached today. |
|
K |
Ratio |
Shows the number of participants posting at the inside bid price "x" the number of participants posting at the inside ask price. This can be set to show instead the number of shares available at the inside bid and ask by checking Compute Ratio by Quantities in the Settings > General menu of the Trading window. |
|
L |
Volume |
Shows cumulative volume for the day. |
|
M |
Close |
Shows yesterday's close price. |
|
N |
Lo |
Shows the lowest price the stock has reached today. |
|
O |
Spread |
Spread shows the difference between the inside bid and ask prices. |
| Order Entry | ||
|
P |
Order Quantity |
There are several ways to change the order quantity.
|
|
Q |
$ (Compute Shares from Quantity) |
Calculates the number of shares for your order from the dollar amount you enter. For instance, if you have $10,000 to spend on a stock that is trading at $5 on the inside ask, you would click the $ button, type "10000", click OK and the share size field will fill in with 2000. NOTE: Commissions are not included in this calculation. |
|
R |
Venue |
SmartEx:
Pre-Market
After Hours
Direct Access: Double-click on the participant in Level II that you wish to send your order to and it will fill in this field with either the ECN, or if a Market Maker, NSDQ. Or click the arrow to see a drop-down list of all routing choices available to you. If you have a stock loaded that is on a listed exchange, you will see the Listed Order routing options. See the individual Order Route topics for information on how each routing venue works. NOTE: The default venue that loads for a security is the last venue used to trade a security on that same exchange. For instance, if you pull up a NASDAQ listed security, the venue loaded would be the last venue previously loaded for a NASDAQ security. OTCBB and NASDAQ will load the same venue unless it is not available. So if for example you have NASDAQ using NSDQ and switch over to an OTCBB symbol, because NSDQ is not supported for OTCBB, the venue loaded will be SmartEx. However, if you go back to a NASDAQ security it will load NSDQ. |
|
S |
Limit Price |
This is where you should enter the price at which you wish to place an order if you have selected a Limit order type. There are multiple methods for entering or adjusting your price.
You may also click on a price in Level II to load it into the price field. Double-click an ECN to route directly to that ECN at their posted price. |
|
T |
Order Type |
Some order routes will have multiple order types, such as Limit, Market, Stop Limit, etc. After selecting your routing venue, choose an Order Type from the drop-down list. See the Direct Access Route Comparison topic for an overview of what Order Types each route may offer. |
|
U |
Time-In-Force |
Some routing venues will have one or more Time-In-Force options, including Immediate or Cancel (IOC), Day (DAY), Fill or Kill (FOK), etc. After selecting your routing venue, choose a TIF from the drop-down list. See the Direct Access Route Comparison topic for an overview of what Order Types each route may offer. |
|
V |
Stop Price/Trailing Stop |
Stop Price: If you choose an order type such as Stop or Stop Limit, enter the stop price here. Trailing Stop: If you choose a Trailing Stop order type, the option for whether to use a percent or dollar value displays here. |
|
W |
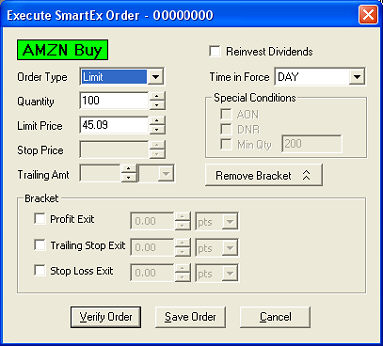
Spec Cond & Brackets |
If checked when you send an order, a Special Conditions window will open allowing you to specify additional conditions for your order, such as Minimum Quantity, All or None, etc. See the topic for the Routing Venue you are using for a description of its available Special Conditions. Brackets can also be enabled for the order, giving you greater risk management controls.
NOTE: If you do not change your order type to Market or use the Spec Cond & Brackets checkbox, StreetSmart Pro will automatically make your order type a Day Limit order. |
|
X |
Close All |
If you are selling a long position, you can check the Close All checkbox to sell the entire position, including fractional shares. Read the Close All Checkbox topic for more information. |
|
Y |
Action Buttons |
Once the order fields are set up to reflect the type of order, price and share size, click on the Buy, Sell, or Short button to route the order. The Cancel button will attempt to cancel the most recent pending order for the stock. Click on Cancel All to cancel all pending orders. If there are no shortable shares, the Sell button will be grayed out. The Save button appears when any SmartEx order route is selected, allowing you to save the order to the saved order window. Hard-to-Borrow (HTB) Indicator Stocks that may be difficult to borrow for shorting purposes will have a "Hard to Borrow" indicator next to the tabs at the top of the Trading Window as shown below. If the stock you wish to short has this indicator, consider that it may be difficult to fill your order. For questions on shortable share availability, please contact Securities Lending at 1-800-355-2448.
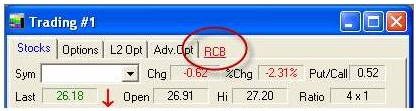
Regulatory Circuit Breaker (RCB) Indicator The Securities and Exchange Commission (SEC) has adopted amendments to Regulation SHO (Reg SHO). Under Rule 201, the SEC has established a short sale-related circuit breaker that, if triggered, will impose a restriction on when and/or at what price a security may be sold short. The short sale-related circuit breaker will be triggered for a security when its price declines by 10% or more from the prior day’s closing value within normal market hours. The regulatory circuit breaker will then remain in effect for the remainder of the day, and at a minimum, throughout the next day’s trading session. The circuit breaker will be triggered during the regular session only. Once triggered, the price test will apply at all times when the national best bid is disseminated through the end of the next trading day. Stocks that have triggered the short sell circuit breaker rule will be annotated with a “RCB” indicator in the Trading Window.
When the regulatory circuit breaker rule is in force, short sale orders will continue to be accepted. However, marketable limit orders and market orders to sell short may be delayed and executed at a significantly lower price than the bid at the time the order was placed. |
| Level II Aggregate | ||
|
Z |
Aggregate Quotes |
|
| Level II | ||
|
a |
Level II |
Shows the depth of all bids and offers in a stock. Each line shows the four-letter Market Maker, ECN ID, or listed stock Exchange, the price at which they are bidding or offering, and the number of shares they are making available at that price. NOTE: Level II data is available to you for a fee if you wish to subscribe to the service. However, the fee may be waived if you meet certain eligibility requirements. For additional information, please contact your Schwab Active Trader Team. Note that NASDAQ quotes and Level II ECN quotes are in upper-case and ECN book quotes (when the book is turned on) are in lower-case. Other non-NASDAQ quotes are noted with an asterisk (*).
Level II Tips
|
| Time & Sales | ||
|
b |
Time & Sales |
Shows every trade being reported through NASDAQ and some ECN book trades, as well as the quantity of the trade (parentheses around the quantity indicates an exact amount of shares, usually an odd lot) and the time of the trade. Time & Sales is color-coded: Green: Prints at the inside Ask Red: Prints at the inside Bid White/Gray: Prints in between the inside Bid/Ask Yellow: Prints above the inside Ask Purple: Prints below the inside Bid Grey Highlight: Inside quote change TIP: Set the number of trades back to view through the Settings > General menu. To expand this view up to the last 1000 trades, right-click in the T&S window and select Request Expanded T&S. |
TIP: You can save screen space in the Trading window by hiding the Order Entry portion of the Stocks Tab. This is especially useful if you keep multiple Trading windows open and only use one to place trades. Right-click in the Trading window and select Hide Order Entry Detail to show only Level I data in the top of the Stocks Tab.
Copyright ©Charles Schwab & Co., Inc. 2011. All rights reserved. Member SIPC. (0411-2708)
 FSI Codes