Click Tools
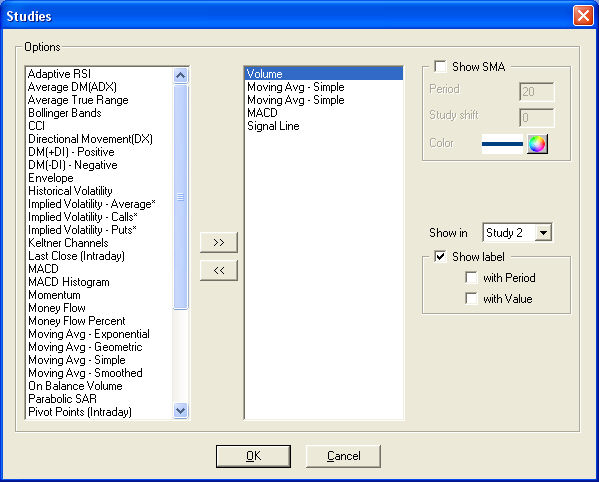
> Studies and the Studies Set-up panel will appear.
Click on a study in the left column.
Click the
>> button to activate the study.
To Customize the Study:
When it appears in the right column, click on
the study to change its Period(s),
Color, Show
in, and Label properties.
To change the default period, click in the window
and add the new variable for your period.
Use the Show
In drop-down to overlay the study in the main chart window or place
the study in a separate pane below the chart.
Study
Data Points: Certain studies
may be more precise when using a larger set of data to calculate the study
results, but occasionally, a chart will not have enough data to maximize
the precision of the results. What StreetSmart Pro® charts do for studies
where this applies is extend the period used to calculate the study up
to 4x the study period to achieve the most accurate study results. Checking
Auto Optimize
will automatically try to achieve the most precise results given the amount
of data available. By unchecking Auto Optimize, you have a choice about
how much data to use in the study calculation. Max
Display will use data only from the number of periods you specify.
Max Precision will use data from the specified number of periods multiplied
by 4.