Charting Overview
|
Charts provide a quick way to absorb data
and understand a security's performance. They provide vast amounts of
data in an efficient, user-friendly, customizable format, making it easy
to analyze price and volume movements in real time.
Add Studies,
Trend Lines, and even technical analysis
Strategies to charts to enhance
your ability to spot trends and buy/sell opportunities.
To open,
click  in the Toolbar. in the Toolbar.
|
StreetSmart Pro® software has advanced charting tools that give you
the freedom to customize your charting experience to your precise specifications.
Features available include more than 25 customizable studies (or indicators);
trend lines and studies including SMA, EMA, Bollinger Bands and Envelopes;
chart types, including point and figure, bar, line, and candlestick; and
much more.
You may display up to 20 chart windows in a single layout with up to
20 tabs (each with unique chart settings) in each window, effectively
allowing you to display up to 400 charts in one layout. Each tab can be
setup to copy the setting from another tab or be unique to the tab itself.
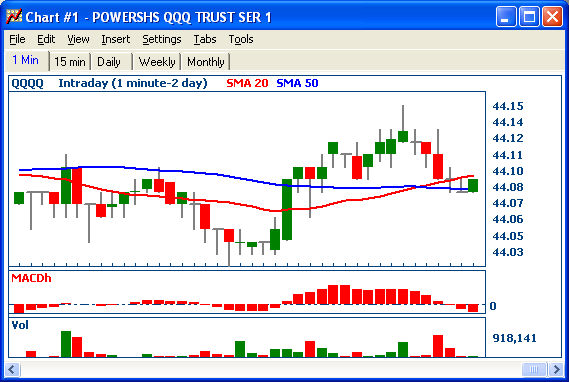
Stock symbols and price and volume data shown here
and in the software are for illustrative purposes only. Charles Schwab
& Co., Inc., its parent or affiliates, and/or its employees and/or
directors may have positions in securities referenced herein, and may,
as principal or agent, buy from or sell to clients.
Copyright ©Charles Schwab & Co., Inc.
2011. All rights reserved. Member SIPC.
(0411-2708)