Strategy Tester

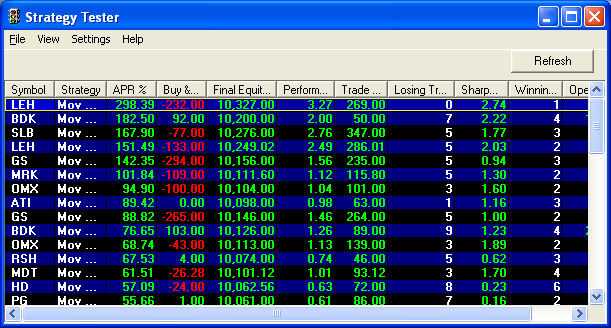
Find out how you would have done in the market if you had used a particular technical strategy. The Strategy Tester is our backtesting tool that combines technical analysis strategies with historical market data to help you make future trading decisions.

You can load results from the Strategy Tester into the Chart tool and the Strategy Ticker® tool to help you find buy or sell opportunities in real-time.

To open the Strategy Tester, click in the Toolbar. Only available during market hours.


The Strategy Tester provides the ability to search through historical performance results of back-tested technical strategies.  It can help you identify the following:

Stock symbols and price and volume data shown here and in the software are for illustrative purposes only. Charles Schwab & Co., Inc., its parent or affiliates, and/or its employees and/or directors may have positions in securities referenced herein, and may, as principal or agent, buy from or sell to clients.

Testing a Strategy

To test a strategy against one or more symbols:

  1. Click Settings > Strategy Center to open the Strategy Center window.
  2. Click on a strategy (notes with a description of each will appear at the bottom of the window when clicked) and click Add. Repeat to add multiple strategies.
  3. If you wish to edit the strategy, you may also do this from the Strategy Center.
  4. Click OK to apply the strategy(ies).

Next, you will need to add the symbol(s) to test against.

  1. Click Settings > Symbol List.
  2. Add the symbol(s) to the list by typing the symbol and clicking Add, or by loading a saved stock list by clicking Load List.
  3. Click OK when you are satisfied with you Symbol List.

Now, you need to set up the parameters for the test:

  1. Click Settings > Bar Sizes. The Bar Size, combined with the Number of Bars to Test in the Back Test Settings (see below) determine the period for which the test is executed.
  2. Check one or more bar sizes. For scalping and other fast turnaround techniques, a 5 Min bar size would be more appropriate, whereas a Daily bar size would be better for someone with a longer term focus in their trading. A separate test will be run for each bar size selected.
  3. Click OK, and you should begin to see some data in your Strategy Tester if you haven't already.
  4. Finally, click Settings > Back Test.
  5. Choose the desired Back Test Settings for the test:
     
    BACK TEST SETTINGS

    Number of Bars for Test

    This is used along with the Bar Size to determine how far back to test and how frequently the price is updated over that period.

    EXAMPLE  If Bar Size = 5 Min and Number of Bars to Test = 100, the test will cover the last 500 minutes and base the test on the last trade price at the end of each 5 minute interval.

    Initial Equity

    Choose from $10,000, $50,000, or $100,000 as the "play money" being used in the test.

    When the first trade is placed in the test, it will start with the initial equity amount. Then, as trading continues, your equity will increase or decrease depending on the success of the trades.

    Best Performance Determination

    Your selection here will determine the initial sort order of the list upon running the test.

    APR% - Annual Percentage Rate. This value is reached by multiplying a year (365 days) by the Performance % and then dividing by the number of days in the simulation. Simple interest used.

    Sharpe Ratio - Risk adjusted profitability for the test time period. $IRX will be used for the Risk Free Rate of Return in the Sharpe formula.

    Total Profit - Total Profit or Loss (includes open positions)

    Quantity per Trade

    Select how many shares or contracts to trade each time a trade is triggered.

    Equities - Choose from 100 Shares, 1000 Shares, 10% of Available Equity, or $5,000.

    Commission per

    Enter an approximate commission amount if you want to factor that into your P&L.

TIPS:  


Copyright ©Charles Schwab & Co., Inc. 2011. All rights reserved. Member SIPC. (0411-2708)