Sectors

View information about companies grouped by sectors, industries, or by sub-industries. Classifications are based on Morgan Stanley Capital International and Standard & Poor GICS (Global Industry Classification Standard).

The Sectors tool can assist traders using a Top-Down investing strategy by identifying the top performing Sector, Industry, or Sub-Industry over any one of many time periods, or in Bottom-Up Analysis to compare an individual equity to its peers in its Sub-industry, Industry, and Sector

To open, click in the Toolbar.


TIP: You can add the stocks in a Sub-industry to the Watch List window by clicking on the Sub-industry and dragging it to the Watch List window. However, the Watch List limit is 100 stocks. If your Sub-industry list is greater than 100, it will only pull over the first 100 securities in the Sub-industry based upon the column that is being used for sorting. If no column has been selected for sorting, it will load in the first 100 securities in alphabetical order.


Click the plus (+) symbol to expand the Sector, Industry, or Sub-industry. Click the minus (-) to contract a category.

Stock symbols and price and volume data shown here and in the software are for illustrative purposes only. Charles Schwab & Co., Inc., its parent or affiliates, and/or its employees and/or directors may have positions in securities referenced herein, and may, as principal or agent, buy from or sell to clients.


FILE

Page Setup

Enables you to customize the current page for printing. Read the Printing Windows topic for more information.

Print

Prints the Sector rows currently displayed.

Export

Exports the Sector rows currently displayed into a tab-delimited text (.txt) file.

Select Export, enter a name for the text file and select the location where it should be saved, and click Save.

Close

Closes the Sectors window.


SETTINGS

Indices

Checking Enable Indices will keep a list of up to 5 indices at the top of your Sectors window at all times.

  1. Enter the index symbols in the fields.
  2. Put a check next to the ones you wish to view.
  3. Click OK when you are finished.

NOTE:  Indices must start with a symbol using $.You cannot use QQQ, SPY, DIA, etc, as these symbols do not start with a $.

Columns

  • Click Settings > Columns to change the data fields displayed in the Sectors window.
  • Move Columns you want to see in the Sectors window over to the Selected Columns.
  • Column data can also be changed by right-clicking the Sector window column heading.
  • You can change the order of the column data by dragging the column heading box to the desired column location.

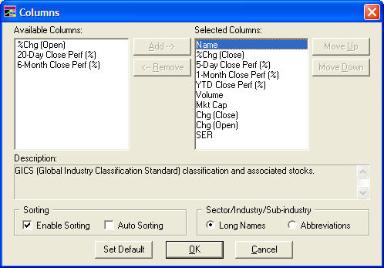
Enable Sorting: When checked, you can simply click on any column header to sort by that column.

Auto Sorting: When checked, the sort order will change in real time as new data comes through. For example, if you were sorting by the Total Volume column and Auto Sorting was checked, the sort order of the watch list would change as volumes changed.

Long Names/Abbreviations: Select which format you would like for displaying the Sector, Industry, and Sub-Industry columns.


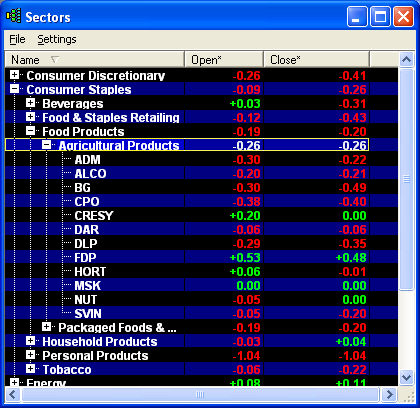
Sector Column Descriptions

  • Name: Shows Sectors, Industries, Sub-industries, and finally, all stocks within each sub-industry.
  • Open*: Total amount the stock has gained/declined since market open.
  • Close*: Total amount the stock has gained/declined since yesterday's close.
  • Open*(%): Percentage of change from open price to current price.
  • Close*(%): Percentage of change from close price to current price.
  • Total Volume: Total cumulative volume for the day.
  • Total Market Capitalization: The total market value of all of a company's outstanding securities.
  • 5-Day Close Perf (%): Difference between the Close from 5 days ago and the Current Price expressed as a percentage.
  • 20-Day Close Perf (%): Difference between the Close from 20 days ago and the Current Price expressed as a percentage.
  • 1 Month Close Perf (%): Difference between the Close from 1 month ago and the Current Price expressed as a percentage.
  • 6 Month Close Perf (%): Difference between the Close from 6 months ago and the Current Price expressed as a percentage.
  • YTD Close Perf (%): Difference between the close from the beginning of the year and the Current Price expressed as a percentage.
  • SER (Schwab Equity Ratings): Schwab Equity Rating evaluates individual stock and provides a 5 point rating scale (A, B, C, D, F) indicating Schwab's outlook on the potential performance of the stock over the coming 12 months. More on Schwab Equity Ratings

Fonts

Click on this option to change this window's font settings.

Colors

Click on this option to change this window's color settings.

* The Global Industry Classification Standard (GICS) was developed by and is the exclusive property of Morgan Stanley Capital International Inc. and Standard and Poor's. GICS is a service trademark of MSCI and S&P and has been licensed for use by Charles Schwab & Co., Inc.


Copyright ©Charles Schwab & Co., Inc. 2013. All rights reserved. Member SIPC. (0312-2067)