|
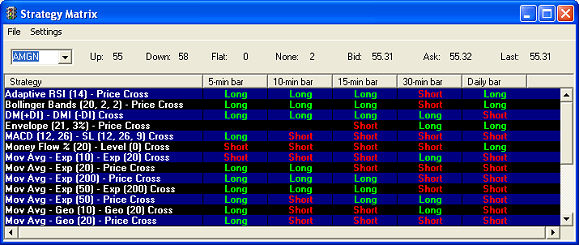
The Strategy MatrixTM tool lets you monitor technical strategies for individual securities or indexes. It monitors the specified security or index for each period to see where that security or index may meet the pre-defined parameters for each technical strategy. To open the Strategy Matrix, click Tools > Start Tool in the main menu and select Strategy Matrix. |
Rather than being limited to monitoring only a few studies for a single period length as you would if you watch the chart, the Strategy Matrix tool can sift through large quantities of data to provide immediate feedback across a broad range of periods and strategies.
You select the technical strategy and time periods the Strategy Matrix tool displays, and it displays in real-time whether each strategy over each period length meets the pre-defined technical analysis parameters. The technical strategies available are similar to studies or combinations of studies in Charts but are programmed to display a possible upward or downward trend based on selected strategies.
Long means a possible upward trend and Short means a possible downward trend.
Stock symbols and price and volume data shown here and in the software are for illustrative purposes only. Charles Schwab & Co., Inc., its parent or affiliates, and/or its employees and/or directors may have positions in securities referenced herein, and may, as principal or agent, buy from or sell to clients.
There are several ways you can customize the window to monitor for what best fits your trading strategy:
TIPS:
Copyright ©Charles Schwab & Co., Inc. 2013. All rights reserved. Member SIPC. (0312-2067)