|
See a graphical representation of your Strategy Tester results in a chart. View the entry and exit points the strategy identifies and instantly see if the stock really did move up or down. To set up, click Tools > Strategy Center in the Chart menu. |
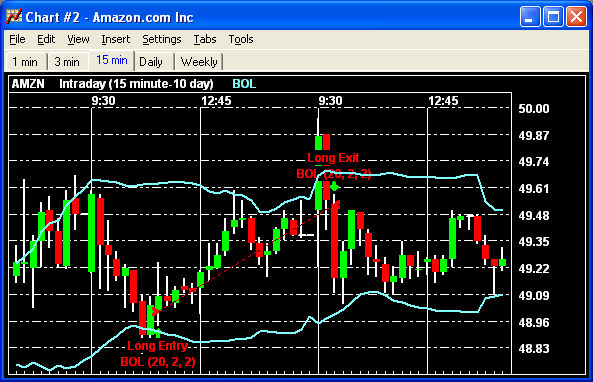
The image below shows long entry and exit points based on the Bollinger Band® strategy, which was applied to the chart.
Stock symbols and price and volume data shown here and in the software are for illustrative purposes only. Charles Schwab & Co., Inc., its parent or affiliates, and/or its employees and/or directors may have positions in securities referenced herein, and may, as principal or agent, buy from or sell to clients.
The strategy testing tools available in the Strategy Tester window are also available here in the Chart window:
TIP: When establishing Back Test settings for a strategy being used in a Chart the "Bar Size" and “Number of Bars for Test” is effectively the same thing as the Interval and the Range in the chart Settings > General.
|
Strategy Center... |
Open the Strategy Center to apply a strategy to the chart. You can also edit or create a new strategy from the Strategy Center. To add a strategy to the chart, click on the strategy in the Available Strategies list and check Show selected strategy on chart. |
|
Edit Strategy... |
Opens the Edit Strategy window for the strategy currently applied to the chart. |
|
Show Strategy |
Once an initial strategy has been applied to the chart, you can use Show Strategy to hide or show the strategy on the chart. |
|
Strategy Performance Details... |
The Strategy Performance Details window breaks down the details and statistics of the strategy being tested in the Chart window. |
Copyright ©Charles Schwab & Co., Inc. 2013. All rights reserved. Member SIPC. (0312-2067)