|
The Chart Toolbar allows quick access to the most commonly used chart features. To enable, click Toolbars > Chart Toolbar in the main menu. |
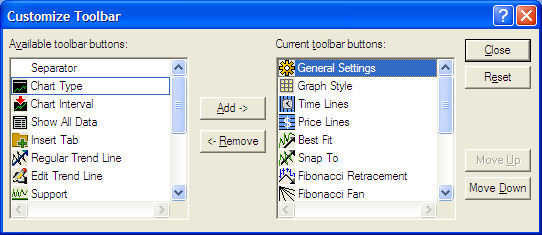
Customize which icons are displayed on your chart toolbar. Select Toolbars > Customize > Chart Tool Bar from the main menu or right-click on the Chart Tool Bar and select Customize... The Chart Tool Bar customization window will open. You can then select which tools you want displayed on your toolbar.
The Chart Toolbar can be displayed vertically on the left/right hand side, or the top or bottom of the frame, or it can be removed to be a free-floating window.
|
Toolbar Features Not all buttons are displayed by default. To add a button, click Toolbars > Customize > Chart Tool Bar in the main menu. |
||
|---|---|---|
|
|
Chart General Settings |
Open the General Settings for the most recently accessed Chart window. |
|
|
Crosshairs |
Select to change your cursor to display a crosshair when you click on the chart. The Crosshair pointer can help you pinpoint prices on a chart more easily than when using the regular cursor. Select again to turn off Crosshairs. |
|
|
Chart Type |
Choose Monthly, Weekly, Daily, Intraday, or Tick |
|
|
Chart Interval |
Choose from 5 to 120 minutes or select Other to open the Chart Settings window where you can enter a different interval. Only applies to Intraday chart types. |
|
|
Add/Edit Studies |
Click to open the Add/Edit Studies window, which lets you add technical analysis studies to your chart. Go to Chart Studies for information on each available study. |
|
|
Regular Trend Line |
Click to draw Trend Lines on the chart. The pointer will change to a pencil icon. Click and drag to draw the trend line. Click the Trend Line button again to stop drawing trend lines (or select another button). |
|
|
Edit Trend Lines |
Click and select from the drop-down list which Trend Line you wish to edit. The button is only available when the most recently selected chart has trend lines drawn on it. The Edit Trend Line window lets you select the type of trend line (regular, Fibonacci, best fit (regression), etc.), as well as the color and label (name) for the line. |
|
|
Support |
Adds a horizontal GREEN line wherever you click on the chart to indicate the Support levels you want to identify in the chart you are viewing. |
|
|
Resistance |
Adds a horizontal RED line wherever you click on the chart to indicate the Resistance levels you want to identify in the chart you are viewing. |
|
|
Insert Tab |
Click to add a new tab to the most recently accessed chart window. You must have Tabbing enabled for the chart in order to click the New Tab icon. |
|
|
Show All Data |
If checked, shows chart for the time frame specified in the Range (days). If unchecked, this will display what is indicated in the Data to show field. A scroll bar will appear at the bottom of the chart allowing you to move back and/or forth through Range (days) selected. |
|
|
Edit Tick Data |
Allows you to change bad chart price data, which may impact the technical studies enabled on the chart. Click the Edit Tick Data button in the toolbar and then click the price point you need to edit on the chart. A window will open that allows you to change all four price points for that period (open, close, high, low). |
|
|
Delete |
Click the Delete icon to see a list of studies and trend lines in the most recently accessed chart so that you may delete one or more of them. You can also chose Delete All Studies to clear all studies from the chart. Delete will not clear support and resistance lines. You must right-click on the line and select Delete to remove it. |
|
|
Graph Style |
Switch between Bar, Candlestick, Line or Point & Figure chart types. Read more about each of these graph styles in the Chart Menu Bar topic. |
|
|
Time Lines |
Click to hide or show the vertical time lines on the chart. |
|
|
Price Lines |
Click to hide or show the horizontal price lines on the chart. |
|
|
Best Fit |
Click the button and then click on the chart to apply a Best Fit Regression trend line to the chart. Read more about Best Fit in the Trend Lines topic. |
|
|
Snap To |
Click the button and then click and drag a line on the chart to apply a trend line that "snaps to" the open, high, low, or close of the trend being studied. To change which price the trend line snaps to (the default setting is Close), click the Edit Trend Lines button in the toolbar and choose the Snap To line you wish to edit. Read more about Snap To in the Trend Lines topic. |
|
|
Fibonacci Retracement |
Click the button and then click on the chart to draw a Fibonacci Retracement line. Read more about Fibonacci lines in the Trend Lines topic. |
|
|
Fibonacci Fan |
Click the button and then click on the chart to draw a Fibonacci Fan line. Read more about Fibonacci lines in the Trend Lines topic. |
|
|
Fibonacci Arc |
Click the button and then click on the chart to draw a Fibonacci Arc line. Read more about Fibonacci lines in the Trend Lines topic. |
|
|
VAP |
Click to show lines bars on the chart where the highest Volume Average Prices have occurred. |
|
|
Alert |
Click to add a Conditional Order or Alert on the security in the most recently accessed Chart window. |
|
|
Load Template |
Click to load a saved template into the current chart. Read more about setting up Chart Templates. |
|
|
Help |
Open the Online Help directly to information on using Charts in StreetSmart Pro. |
Copyright ©Charles Schwab & Co., Inc. 2011. All rights reserved. Member SIPC. (0411-2708)