|
The Strategy Performance Details window breaks down the details and statistics of a strategy test. It is available in both the Strategy Tester and Chart windows. To view, click Settings > Back Test in the Strategy Tester. |
The Strategy Performance Details window has 5 tabs, each described below. Click on the tab names to view a description of the fields in each tab window.
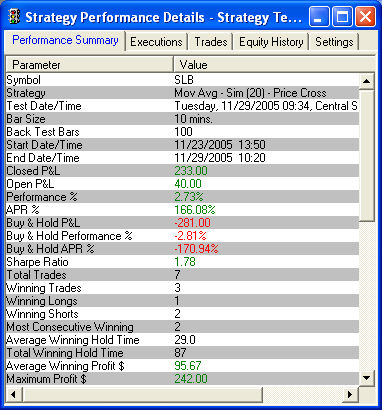
Performance Summary - A total breakdown of the details of the test as a whole.
Stock symbols and price and volume data shown here and in the software are for illustrative purposes only. Charles Schwab & Co., Inc., its parent or affiliates, and/or its employees and/or directors may have positions in securities referenced herein, and may, as principal or agent, buy from or sell to clients.
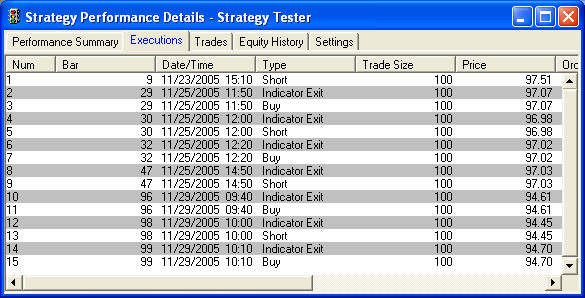
Executions - A list of each execution sorted chronologically, including information about the type of trade and which strategy triggered the trade.
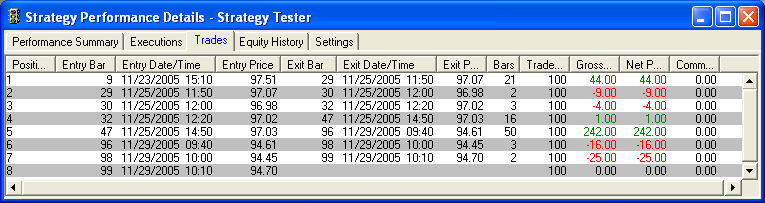
Trades - Shows each round trip trade, entry/exit time and price, gross and net P&L, etc.
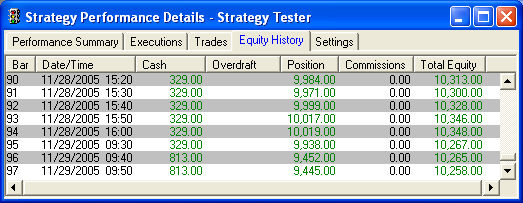
Equity History - Tracks your starting equity chronologically, as well as indicating where commissions were applied.
Settings - Shows a summary of the settings used in the test.
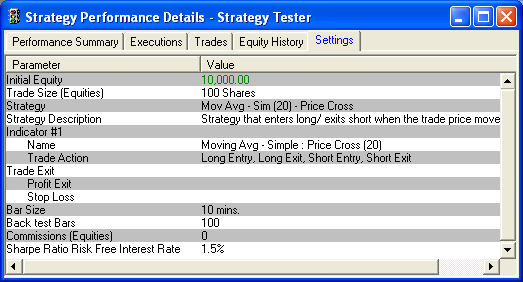
You can also change the Back Test settings from the Performance Details window to see how having a different starting equity or trade quantity, or adding commissions to the cost of the trades, will affect the outcome of the test. Click Settings > Back Test in the Performance Details menu to configure those settings.
Strategy testing past performance data should not be construed as indicative of future results.
Copyright ©Charles Schwab & Co., Inc. 2013. All rights reserved. Member SIPC. (0312-2067)