Strategy Overview
|
Find out how you would have done in the market
if you had used a particular technical strategy. The Strategy Tester is
our backtesting tool that combines technical analysis strategies with
historical market data to help you make future trading decisions.
You can load results from the Strategy Tester
into the Chart tool and the
Strategy Ticker®
tool to help you find buy or sell opportunities in real-time.
To open
the Strategy Tester, click  in the Toolbar. in the Toolbar.
|
StreetSmart Pro®
offers a comprehensive suite of tools that work in concert to assist in
providing a more user-friendly approach to technical analysis than is
often found in institutional trading software. If you use trading strategies
based on technical analysis principles or if you are interested in using
back testing as part of your stock selection process, the following tools
aim to facilitate your efforts:
Strategy Center - At the heart of
the Strategy tools is the Strategy Center, where you create, save, and
manage all the strategies you use in the Strategy tools. A strategy consists
of one or more indicators (such as a price crossover on Bollinger Bands®,
Moving Average, Envelope, etc.) with an associated trade action (such
as Long Entry, Short Exit, etc).
The information you get from each strategy depends on what tool you
apply it in. For example, applying a strategy in the Strategy Tester tool
or in a Chart will apply the strategy for a certain period of time going
backwards to see how well the selected strategy would have performed historically
for a stock or list of stocks. Whereas in the Strategy Ticker and Strategy
Matrix, the strategies are applied to real-time data in order to flag
occurrences of the selected strategy crossing whatever threshold is set
by the strategy.
The Strategy Center is accessible from any of the Strategy tools or
from your Charts.
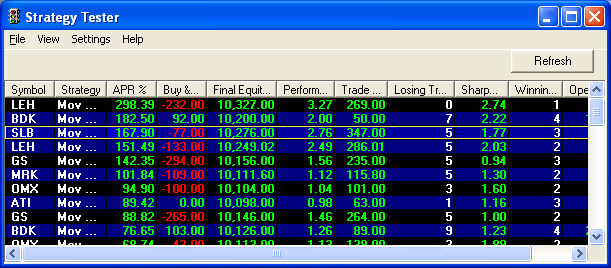
Strategy
Tester - Provides the ability to search through historical
performance results of back-tested technical strategies. It
can help you identify the following:
- Best performing Securities
for a given Technical Strategy and Bar Size
- Best performing combination
of multiple Securities, Technical Strategies, and Bar Sizes
- Best 50 performing Technical
Strategies for a Security and Bar Size
Stock symbols and price and volume data shown here
and in the software are for illustrative purposes only. Charles Schwab
& Co., Inc., its parent or affiliates, and/or its employees and/or
directors may have positions in securities referenced herein, and may,
as principal or agent, buy from or sell to clients.
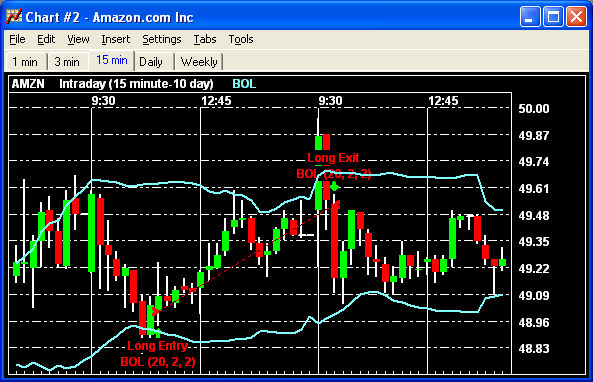
Charts
- Visualize your back testing entry and exit points for individual positions
in your charts. The Charts tool has the same strategies available to it
as the Strategy tools, and many of the studies in the Charts can be viewed
in concert with the corresponding Strategy to help you identify what triggered
each trade.
EXAMPLE In
the image below, we have a Bollinger Band® study along with a strategy
utilizing a Bollinger Band indicator. You can see where the closing price
of any 15 minute bar crosses over the lower line, an entry is triggered,
and where it crosses above the top line, the position is exited.
Stock symbols and price and volume data shown here
and in the software are for illustrative purposes only. Charles Schwab
& Co., Inc., its parent or affiliates, and/or its employees and/or
directors may have positions in securities referenced herein, and may,
as principal or agent, buy from or sell to clients.
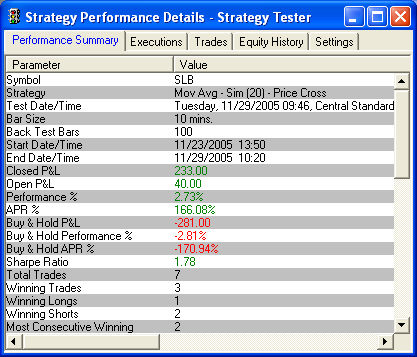
Strategy
Performance Details - For the historical testing tools like
the Strategy Tester and Charts, Performance Details provide a wealth of
data for each stock and strategy combination being tested. It not only
summarizes all the data collected in the process of the test, such as
performance percentages, buy & hold performance stats, winning/losing
trade stats, hold times, etc., but it also breaks down each execution,
each round trip trade, and tracks equity history.
You can even change your Strategy Tester settings (i.e. changing the
estimated commission per trade, quantity per trade, initial equity, period
for the test, etc.) to see immediately how they affect the bottom line
in the test.
Stock symbols and price and volume data shown here
and in the software are for illustrative purposes only. Charles Schwab
& Co., Inc., its parent or affiliates, and/or its employees and/or
directors may have positions in securities referenced herein, and may,
as principal or agent, buy from or sell to clients.
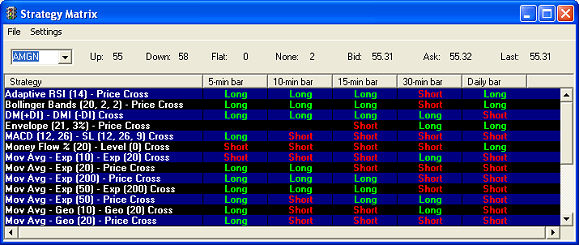
Strategy Matrix™
- The Strategy Matrix tool lets you monitor technical strategies for individual
securities or indexes crossing thresholds specified by the strategies
being monitored.
Stock symbols and price and volume data shown here
and in the software are for illustrative purposes only. Charles Schwab
& Co., Inc., its parent or affiliates, and/or its employees and/or
directors may have positions in securities referenced herein, and may,
as principal or agent, buy from or sell to clients.
Strategy Ticker®
- The Strategy Ticker tool monitors the entire market and/or a defined
set of equity or index symbols in real-time for triggers against specific
technical strategies.
Once you have established one or more strategies to use in your trading,
the Strategy Ticker and Matrix tools will help identify opportunities
based on those strategies using real-time data.
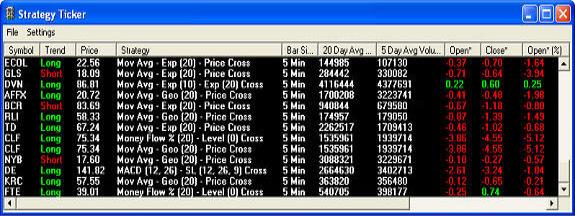
Stock symbols and price and volume data shown here
and in the software are for illustrative purposes only. Charles Schwab
& Co., Inc., its parent or affiliates, and/or its employees and/or
directors may have positions in securities referenced herein, and may,
as principal or agent, buy from or sell to clients.
Copyright ©Charles Schwab & Co., Inc.
2013. All rights reserved. Member SIPC.
(0312-2067)